Blessed is he who expects nothing, for he shall never be disappointed
– Alexander Pope
It has been said that to know where you are going, you have to know where you have been. A reflection on past experience can often serve to inform decision-makers on potential outcomes in a variety of scenarios. The caveat is that events unfolding at different points in time can rarely be compared perfectly to draw identical conclusions. However, the weight of history is nonetheless a powerful guidepost in supporting a chosen path.
Equity Returns: Time to Moderate Expectations
Risk assets such as equities have delivered fairly healthy returns in the years since the Global Financial Crisis of ‘08-’09. Most people would consider the nearly decade-and-a-half of elapsed time since that time to be sufficient enough to draw conclusions that equity market returns over this time to be reasonable to expect “on average” over time. The reality is that this period should not be considered as an appropriate indication of long-term returns. The post-crisis performance is influenced by an exceptional macroeconomic backdrop. Interest rates fell to ultra-low levels and largely remained highly accommodative in response to the financial crisis, inflation was below target, and financial capital flowed further out the risk curve in search of yield and growth.
In other words, the rising tide created by low interest rates lifted all boats, including equities, real estate, commodities and alternatives. Consider the S&P 500 Index, which given its size and liquidity, attracts domestic and global equity investors and is often one of the most referenced benchmarks. Figure 1 shows the annualized performance of the S&P 500 Index, from 2009 to the present (shortly after the Fed first took interest rates to near-zero). Figure 2 shows annualized 10-year performance over many decades – both figures reflect returns on a price only basis. As can clearly be seen, the annualized performance since 2009 is significantly above the average annualized 10-year performance over the long-term.


The reality is that the often-cited 10-year annualized performance trended higher thanks to several recent years of outsized performance – the sharp equity decline in 2022 did moderate this trend somewhat. Figure 3 shows the trend in 10-year performance over the past decade, with the shading of the circles from lighter to darker representing older to more recent data points, respectively. While not a perfect linear move upward and to the right, it is hard to argue that this has largely been directionally accurate over the past several years.

The key question that arises when visualizing the data in these charts is whether this outperformance relative to longer term averages is really sustainable in the current reality, or does a move toward more average performance seem rational? Some of the ongoing challenges equities are contending with include above-target inflation and higher interest rates, rising government and household debt, near-full employment and geopolitical tensions affecting everything from trade policy to supply chains. Given these hurdles, it is hard to make the argument that recent past is highly indicative of the outlook.
Fixed Income Returns: A Brighter Outlook
While the years since the post-financial crisis saw risky assets benefit from lower interest rates, this generally had the opposite effect on average fixed income returns, particularly high-quality, low-risk bonds. Bond returns are generally comprised of price changes as well as income generation from their coupons (reflected in yields). As interest rates came down, bond prices generally moved higher, causing yields to go lower. Ultimately, as interest rates reached abysmally low levels, there was a much lower contribution to returns from income, leaving prices as a key performance driver in either direction. That did not leave much room in recent years to offer more than anemic total returns. When looking at US 10-year Treasury yields on a long-term historical basis, the trend reveals a secular decline from the early 1980s through 2020 (see Figure 4).

However, the ultra-low yields reached during the pandemic left little room for further decline and consequently price increases – barring a persistent move into negative yield territory. If one believed that near-zero policy rates were the extreme the Fed would entertain, then at some point a reversal should unfold. In other words, if the economy no longer needed the life support provided by government stimulus and loose monetary policy, then some degree of “normalization” in interest rates, and subsequently bond yields, would eventually follow. While rates began their upward move in 2022, this was much later than many originally envisioned, and as low rates persisted, many began to think low rates were here to stay.
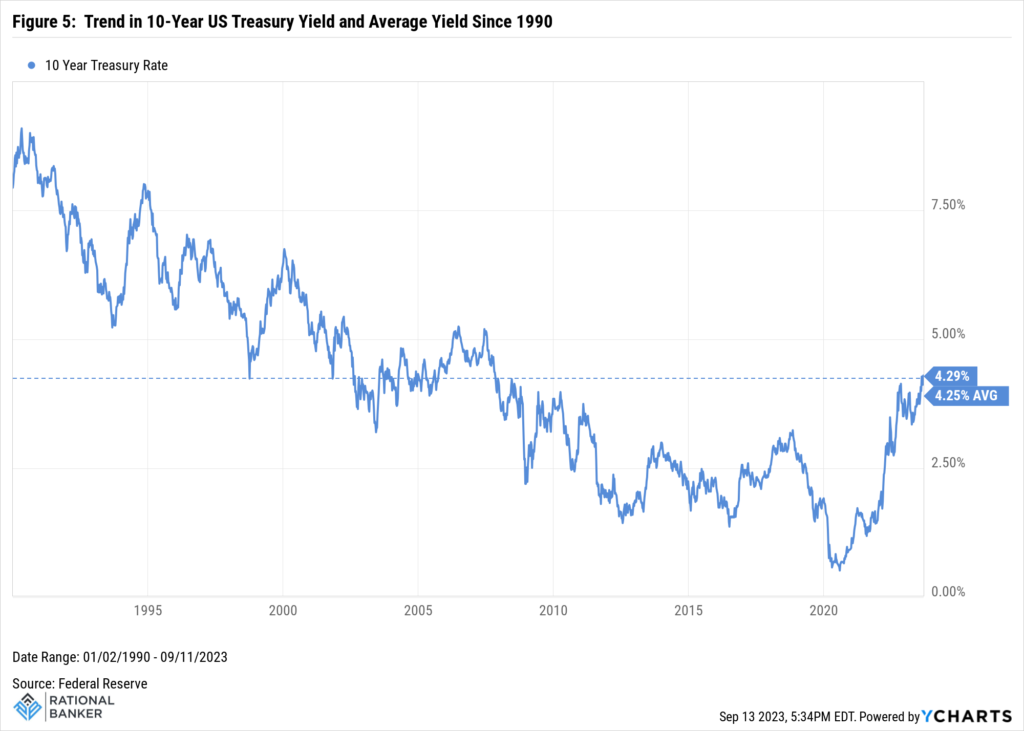
While current bond yields look better than they have at any point over the past decade, the past decade is hardly a period that is representative of experience across economic cycles. When looking further back, we can see that current yields are not as out-of-place as one might first expect (see Figure 5).

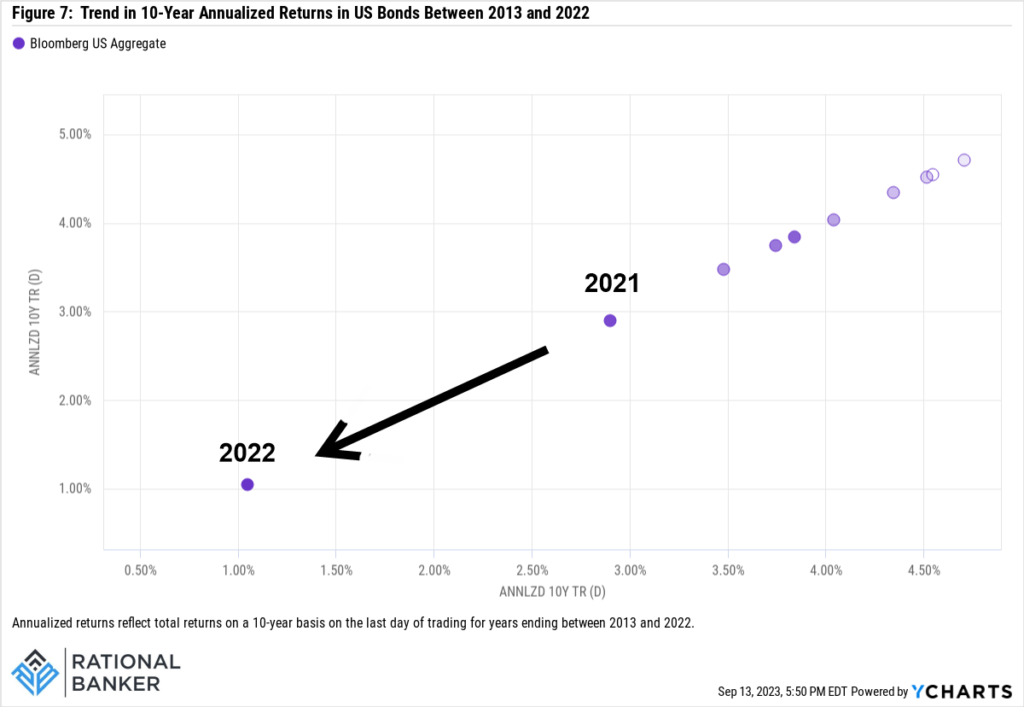
This improved yield picture bodes well for potential fixed income returns as we look ahead as well. For instance, Treasuries now yield more than 4% across the maturity curve. This means even investors with lower risk appetites have opportunities to generate total returns that look much better than they have in several years. With yields having compressed to low levels in recent years, this brought down broader 10-year annualized fixed income return data as well (Figure 6).

Looking back to 2006, Figure 7 shows how far and how sharply below average this measure fell before starting to reverse. This is in stark contrast to the recent performance trend of the S&P 500 figure displayed earlier. While historical data is not a guarantee of future performance, there are reasons to believe a continuation of the improving trend in average 10-year annualized performance over time will continue. For one, the Fed is likely closer now to the end of its rate hiking cycle, which eases downward pressure on bond prices. Additionally, equity valuations remain elevated, while uncertainty over the economic outlook and geopolitical tensions are likely to provide support to bonds as a safe-haven asset. Should the economy soften too much, it could pressure the Fed to ease monetary policy and this would be a positive for bond performance.

The Bottom Line
Trying to make forecasts about relative or absolute performance across asset classes is a fool’s game. Historical data can be useful in helping to manage expectations and reducing the potential for emotion or biases factoring into our investment decisions. Equity and fixed income returns have experienced above- and below-average performance over the past several years, respectively. Ultra-low interest rates encouraged or forced many investors to take on additional risk in search of yield and growth. Alongside rising interest rates and changes in the broader macroeconomic environment, the outlook and risk-reward profiles of equities and fixed income has shifted. In the current backdrop, and with the weight of history as a reference, investors would be well-served to take a hard look at their asset allocation and determine if it reflects their specific circumstances and long-term goals. A further review of the holdings within each asset class may be necessary. This can help ensure that that there are no red flags such as a high level of concentration or overlap. This may have occurred unintentionally over time due to market performance. Ultimately, disciplined decisions based on long-term goals can help avoid unnecessary missteps along the way. Afterall, investing is challenging enough, we certainly do not need to make it more complicated by giving ourselves more hoops to jump through!


