Download Pdf File

Relying on Historical Information? Be Mindful of Data Fickleness

There’s an old investing adage: past performance is not an indicator of future results. It is one of those timeless pearls of investing wisdom. While analyzing data is a natural part of the investing process, the volumes of information available to consider can often lead investors to seek out ways to streamline decision-making. The downside of streamlining is that important information may be filtered out in the effort to maximize efficiency by focusing on a “core” set of data. So many of us, and that includes yours truly, will look at past performance data as part of our consideration. This is normal, but can be a tricky exercise. Using longer-term data doesn’t necessarily eliminate the shortfalls of data fickleness. The following examples should serve to underscore the point.

First Scenario: Looking at historical risk and return data of U.S. equities to make an investment decision

Let’s rewind to a year ago – late 2021. You’re looking at your investments and thinking maybe you should have a higher allocation to U.S equities. You take a look at some key data to see if there is objective information that supports this idea. Table 1 shows you some information on performance and risk measures over a 5-year period as of October 31st, 2021.

TR = Total Return
Source: YCharts. Data as of November 28, 2022

When looking at the above information, at least as far as returns go, the broad S&P 500 returns look phenomenal in absolute terms, with the tech-heavy Nasdaq an even more astounding 25%-plus annualized over the five years ending Oct. 31st, 2021.
So, what happens to the five-year performance results on these two U.S. equity benchmarks as we progress through the next year? Check out Table 2 below.

TR = Total Return
Source: YCharts. Data as of November 28, 2022

Looking at the above returns, starting at the far right, you can see the returns from Table 1 replicated. However, as you progress over the year, you will notice a decline in the 5-year annualized return with each new end date. One full year later and the five-year returns drop by a whopping 50%-plus in the case of the Nasdaq. Even the more broadly diversified S&P 500 Index’s 5-year annualized return drops by over 40%. The five-year returns still look excellent in absolute terms, but they are nowhere near as compelling as they were just a year earlier.

What is the significance?

Investing involves a high degree of emotion and psychology. On the other hand, industry professionals consistently advocate for the need to maintain a disciplined, long-term perspective and stick to a well-crafted investment plan to avoid getting derailed. However, our personal biases are often a factor to contend with, particularly in times of market volatility. Returning to Table 2, it is interesting to note that the standard deviation, a measure of risk that captures the range of returns, also increased over that period. So, investors had to expect higher levels of volatility with declining returns. Not exactly an appealing combination, but seasoned investors would acknowledge that the elevated returns we were witnessing a year ago were more an anomaly than typical.

Second Scenario: Reviewing performance of equities and bonds to establish asset mix

As with the first scenario, we want to look at past performance to highlight the influence of the ending date on an investor’s perception of relative attractiveness (in terms of risk and return). In this scenario, the comparison is between stocks and bonds. We will use the S&P 500 Index and the Bloomberg US Aggregate Bond Index for the comparison. We will look at three different end dates to show the impact that they can have even on long-term results.

Figure 1 displays the 10-year performance to the end of October, 2007 – the month that the S&P 500 peaked prior to the onset of the global financial crisis (GFC). The results show the value of $10,000 invested over the 10-year period in each investment, as well as the annualized 10-year return.

Figure 1

The relative performance displayed above with U.S. equities outperforming U.S. bonds would make sense to investors. This is because equities are considered a higher risk/higher return asset class. In fact, it would be understandable that investors may be surprised that the performance between the two was as close as it was, but that is a separate discussion.

Figure 2 displays the 10-year performance to the end of March, 2009 – which includes the U.S. equity market bottom during the GFC.

Figure 2

Dramatic shift in the relative performance between bonds and stocks, right? With less than a year-and-a-half between the end dates of the time periods in Figures 1 and 2, the results change from a moderate US equity outperformance over a 10-year period to a significant US equity underperformance over a 10-year period! This should serve to show how sensitive even long-term historical data can be to significant market volatility over a relatively short timeframe.
An investor looking at Figure 2 after the market bottom and the volatility experienced in equities throughout the GFC might be thinking that for all the extra risk they took in equities, the pay-off wasn’t worth it. Afterall, the data doesn’t imply just a bad year, but a lost decade in equities with an annualized return of -3% over that timeframe. In other words, not only has the $10,000 invested in equities not grown over a 10-year period, it is worth less (only $7,300)! When depicted in chart form, the smooth assent of the bonds relative to the peaks and troughs of the equities also doesn’t bring a person much comfort.
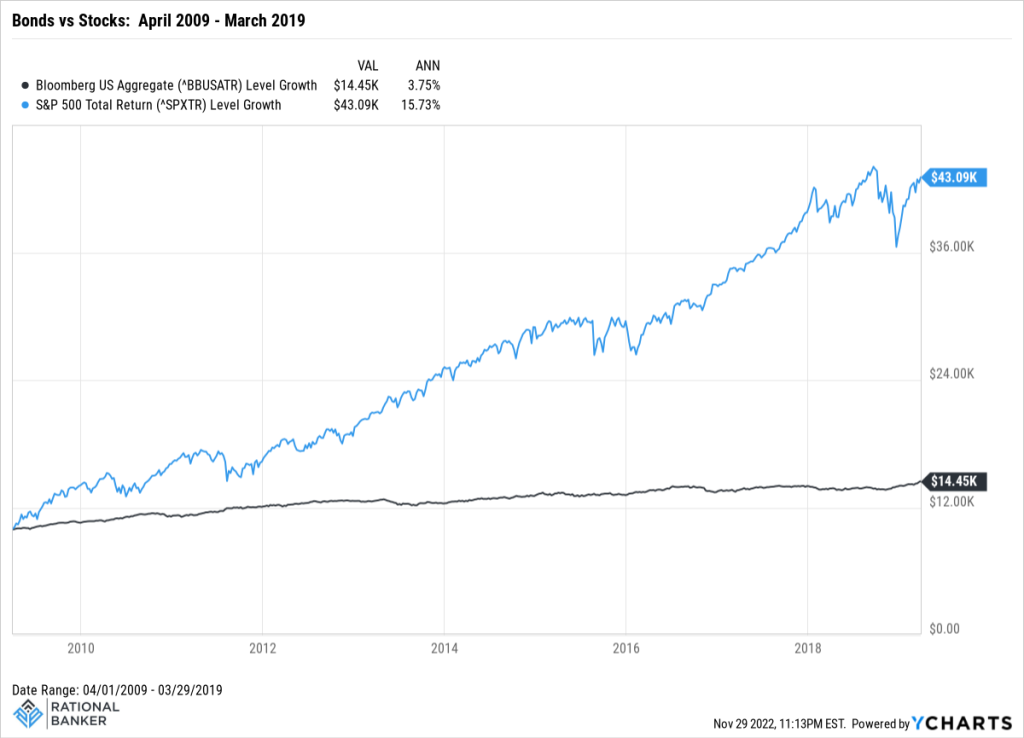
So, if at that point, an investor threw in the towel on equities, choosing to go with high quality bonds instead, how would the next 10 years have fared? Let’s take a look at Figure 3 below.

Figure 3

The results certainly bring up a familiar expression – hindsight is 20/20!  So, after having endured a more than 50% decline from market peak to bottom during the GFC and making a complete shift to fixed income based on the historical performance data in Figure 2, an investor would have been disappointed once again.  Their fixed income portfolio grew by an annualized 3.8% per year – not horrible in absolute terms, but on a relative basis the equity exposure they gave up grew by a stunning annualized 15.7% per year!  The $10,000 invested in bonds grew to $14,500 while if it had been allocated to stocks it would have grown to a whopping $43,000! 

You may think these are extreme scenarios being highlighted.  The reality is that there were many individual investors who were truly impacted by the extreme volatility during the GFC.  Some made significant changes to their portfolios that reflected the market environment rather than what was suitable for their specific circumstances.  By looking to reduce risk exposure in one area, they introduced added risk elsewhere and that may have had material long-term implications on their financial well-being.

Key takeaways

The purpose behind looking at historical performance and risk data in this article is not to suggest that data is manipulative or fraught with problems. The intention is to highlight that while it is important to take past information into account, at the same time limitations to relying solely on historical data should be acknowledged. No investment decision-making process or philosophy is perfect in assessing the risk/reward profile of an investment comprehensively. At the end of the day, it is less about what the investment has done in the past, and more about how it fits into a comprehensive investment plan designed to address your specific needs.

Disclaimer: The above information does not constitute advice, nor is it a recommendation to buy or sell any investments or financial products and services. While the information contained is believed to be accurate, neither Rational Banker nor any persons or entities associated with it an be held responsible for any errors. Prior to making any financial decisions, please do your own due diligence and/or speak with a professional to determine the suitability of such decisions