
Major U.S. equity indices are all in positive territory this year, and while growth stocks are leading the way, even the broader S&P 500 is up a remarkable ~15% (Figure 1). While this appears impressive, not all investors replicate “the market” for their equity exposure. At the surface, indices can mask some of the sharp differences in performance at the sector level. As such, investor experiences can vary pretty wildly based on their portfolio mix.
Figure 1
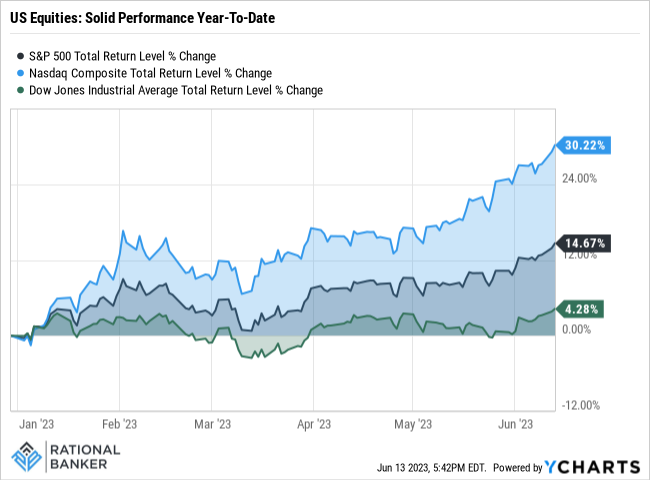
US Equity Performance Has Not Been Broad-Based
Gauging the strength of this year’s rally based on sector performance using the SPDR ETFs as proxies can provide some insights. A look at Figure 2 below shows that the lion’s share of gains come from sectors that are heavily dominated by large-cap technology-focused growth stocks. In fact, of the 11 sector ETFs, five of them are in negative territory on a year-to-date basis, while another three lag meaningfully behind the S&P 500 Index’s performance. There are a couple of key themes driving current strength in the tech space. One is the optimism surrounding generative artificial intelligence (AI) and expectations for its applications across the economy and our daily lives. The other is rising expectations that the Fed may be moving towards a pause in its rate hike campaign. The Fed will have an interest rate decision this week, which should provide more clarity on this front. Either way, the recent rally has priced in a healthy amount of optimism around the interest rate outlook. Bear in mind, interest rates are significantly higher than they were a year ago and are not likely to come down in the near term, which still poses headwinds for economic growth. On the generative AI front, this technology remains in early stages. This reality also means it is too early to have a clear understanding of its full implications and the areas most impacted by its reach. Yet, valuations of perceived beneficiaries of the coming boom are already at lofty levels, pricing in a very rosy outlook.
Figure 2
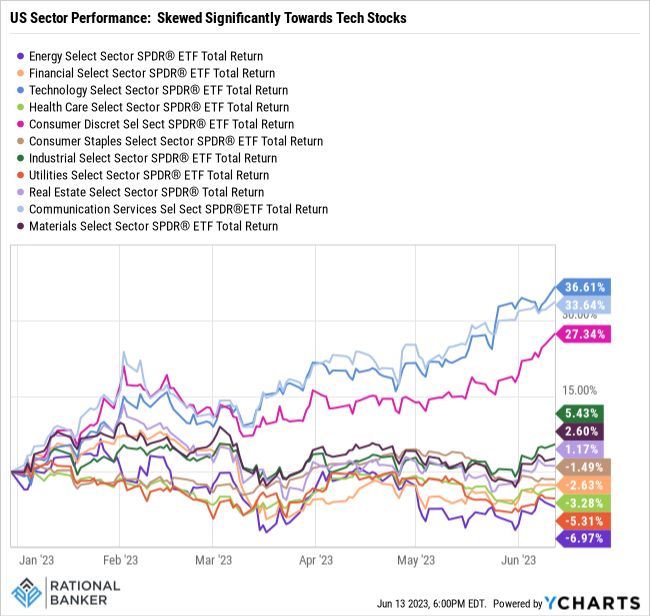
Big Tech Stocks Are Getting Even Bigger
After a taking a breather during last year’s volatility, growth stocks have made a significant jump higher. The result has been relative outperformance that has literally left most other sectors in the dust, and driving up their weights in the broader S&P 500 significantly since year-end. A comparison of an ETF proxy for the key equity benchmark, shows the top 10 holdings and their respective weights below. Note that Alphabet (Google’s parent company) has two share classes, A and C, that are listed separately but are combined to represent the company’s full weight in the ETF (Table 1). To underscore the outperformance of a small number of companies, take a look at the changes in the combined weights of five stocks: Apple, Microsoft, Amazon, Alphabet, and NVIDIA. The collective weight of these companies at the end of 2022 was 18.2%. By the end of May, these same five stocks had a collective weight of 24.1%. That is a relative increase of over 30% for these companies and would translate into a similar result for their weight in the S&P 500 Index. In other words, barely one percent of the benchmark accounts for nearly one quarter of its market value. This is both a significant feat, and also a warning of the level of concentration, within even a fairly broad index. It highlights that the need for ongoing reviews of portfolio asset mix and equity allocation is important to ensure suitable diversification.
Table 1

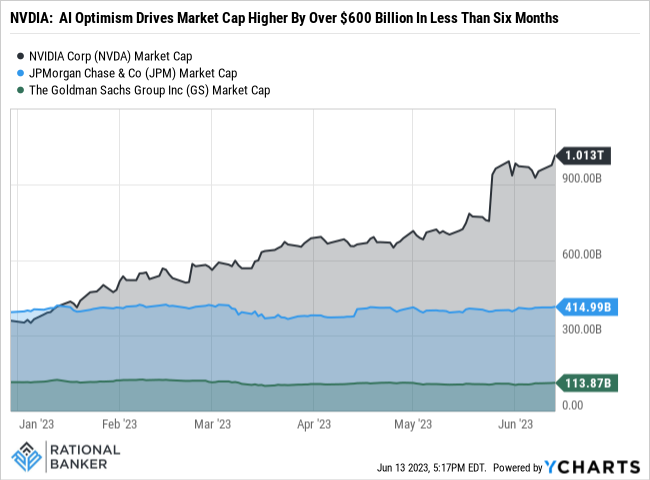
Fun fact: NVDIA’s stock performance is one of the standouts among large-cap growth stocks, up 170% this year. Put another way, in less than six months, the company has grown by more than the combined market values of JP Morgan and Goldman Sachs combined (Figure 3)!
Figure 3
Diversification Can Enhance Risk-Reward Dynamics
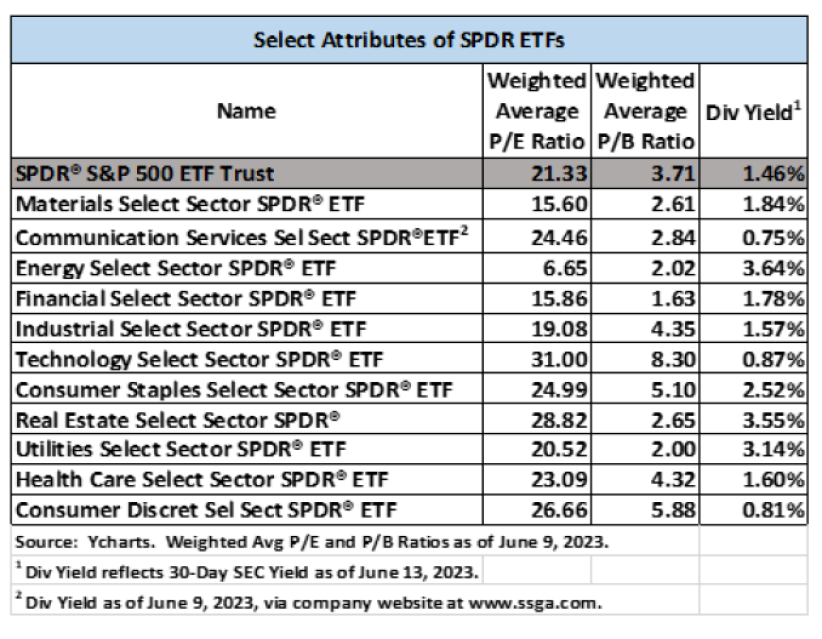
The US equity market’s skewed performance this year presents opportunities for disciplined, long-term investors. Equities across a range of sectors continue to display solid operating results, reasonable valuations and dividend yields to boot. A look at Table 2 below provides a comparison of attributes for the different Sector SPDR ETFs to give an indication of the differences between sectors. Diversifying to include companies across sectors as well as the value-growth spectrum can help create a win-win scenario by better mitigating against periods of market volatility while expanding your portfolio’s sources of potential future growth.
Table 2
Final Thoughts
Indices can sometimes mask the reality that lies beneath their surfaces. An index may show a strong or poor overall performance over given timeframe. One might assume this observation extends across all of the index’s components, but this is not typically the case. Many businesses and sectors are impacted differently by macroeconomic, geopolitical, regulatory and ESG developments, for example. This can make it challenging to navigate the investment landscape. However, ambiguity and uncertainty can also offer attractive entry points into quality businesses with favourable risk-reward trade-offs. Having a prudent investment approach that builds on diversification as a cornerstone is one way to better position investment portfolios for long-term success and robustness against inevitable market setbacks.
Disclaimer: Data sourced from YCharts unless otherwise noted. The above information does not constitute advice, nor is it a recommendation to buy or sell any investments or financial products and services. The author may have positions, either long or short, in some or all investments mentioned in this article. While the information contained is believed to be accurate, neither Rational Banker nor any persons or entities associated with it can be held responsible for any errors. Prior to making any financial decisions, please do your own due diligence and/or speak with a professional to determine the suitability of such decisions.